.NET Dumps: A Comprehensive Guide
In the world of .NET development, debugging production issues can be challenging, especially when problems occur in live environments. .NET dumps provide a powerful way to capture a snapshot of your application’s state, enabling post-mortem analysis without the need for live debugging. This guide will equip you with the knowledge to effectively use .NET dumps for diagnosing crashes, memory leaks, performance issues, and more.
What we’ll cover:
- What .NET dumps are and why they matter
- When and how to capture dumps using various tools
- Techniques for analyzing dumps with
dotnet-dumpand Visual Studio - A deep dive into .NET memory management and GC internals
- Practical examples for diagnosing memory leaks and long-lived objects
- Tips for controlling the GC and fine-tuning your applications
Whether you’re a seasoned developer or just starting with .NET diagnostics, mastering dumps can significantly reduce downtime and improve application reliability. Let’s dive in!
What is a .NET Dump?
A .NET dump file, often referred to as a memory dump or minidump with heap, is a comprehensive snapshot of a process at a specific moment. For .NET applications, it captures:
- Memory Contents: The entire address space, including managed heap, native heap, and stack allocations.
- Thread Information: Call stacks, CPU registers, and thread-local storage for all threads.
- Module Details: Loaded .NET assemblies, native DLLs, and their versions.
- System Handles: Open files, network connections, and other resources.
- CLR Internals: AppDomains, JIT-compiled methods, and garbage collection state.
This wealth of data allows for offline analysis, making dumps indispensable for troubleshooting issues that can’t be reproduced in a development environment.
When to Capture a Dump?
Dumps are invaluable in various scenarios where live debugging isn’t feasible:
- Unhandled Exceptions: To identify the root cause of crashes.
- Performance Bottlenecks: High CPU or memory usage investigations.
- Memory Leaks: Detecting objects that aren’t being garbage collected.
- Deadlocks and Hangs: Analyzing blocked threads.
- Resource Exhaustion: Understanding handle leaks or excessive allocations.
Capturing dumps at the right time ensures you have the necessary data for effective diagnosis.
How to Capture a .NET Dump
The choice of tool depends on your platform and requirements. Here are the most common methods:
Cross-Platform: dotnet-dump
dotnet-dump is a versatile CLI tool for .NET Core and .NET 5+ applications.
- Installation:
1
dotnet tool install -g dotnet-dump
- List Processes:
1
dotnet-dump ps
- Capture Dump:
1
dotnet-dump collect -p <PID>
This creates a full dump with heap data.
Windows: ProcDump
For advanced triggering on Windows:
- On CPU Spike:
1
procdump -ma -c 80 -s 10 <ProcessName>
- On Exception:
1
procdump -ma -e 1 <ProcessName>
Integrated Development Environment: Visual Studio
For development environments:
- Open Debug > Windows > Processes.
- Attach to your process.
- Right-click and select Create Dump File.
How to Analyze a .NET Dump
Analysis tools allow you to inspect the dump’s contents interactively.
Using dotnet-dump analyze
Load and explore dumps with commands:
1
dotnet-dump analyze <DumpFile>
Key commands:
clrstack: View managed call stacks.dumpheap -stat: Heap summary by type.threads: List all threads.
Using Visual Studio
- Open the
.dmpfile. - Switch to Managed Only debugging.
- Inspect threads, memory, and heaps.
Understanding Object Management in .NET Memory
Memory management is a critical responsibility of any modern runtime environment. In the .NET ecosystem, memory is managed primarily by the Common Language Runtime (CLR). The CLR abstracts low-level memory concerns away from developers, allowing them to focus on application logic rather than manual memory allocation and deallocation. Analyzing .NET dumps often involves understanding these mechanisms, which is crucial for diagnosing memory leaks, performance issues, and crashes.
Memory Architecture in .NET
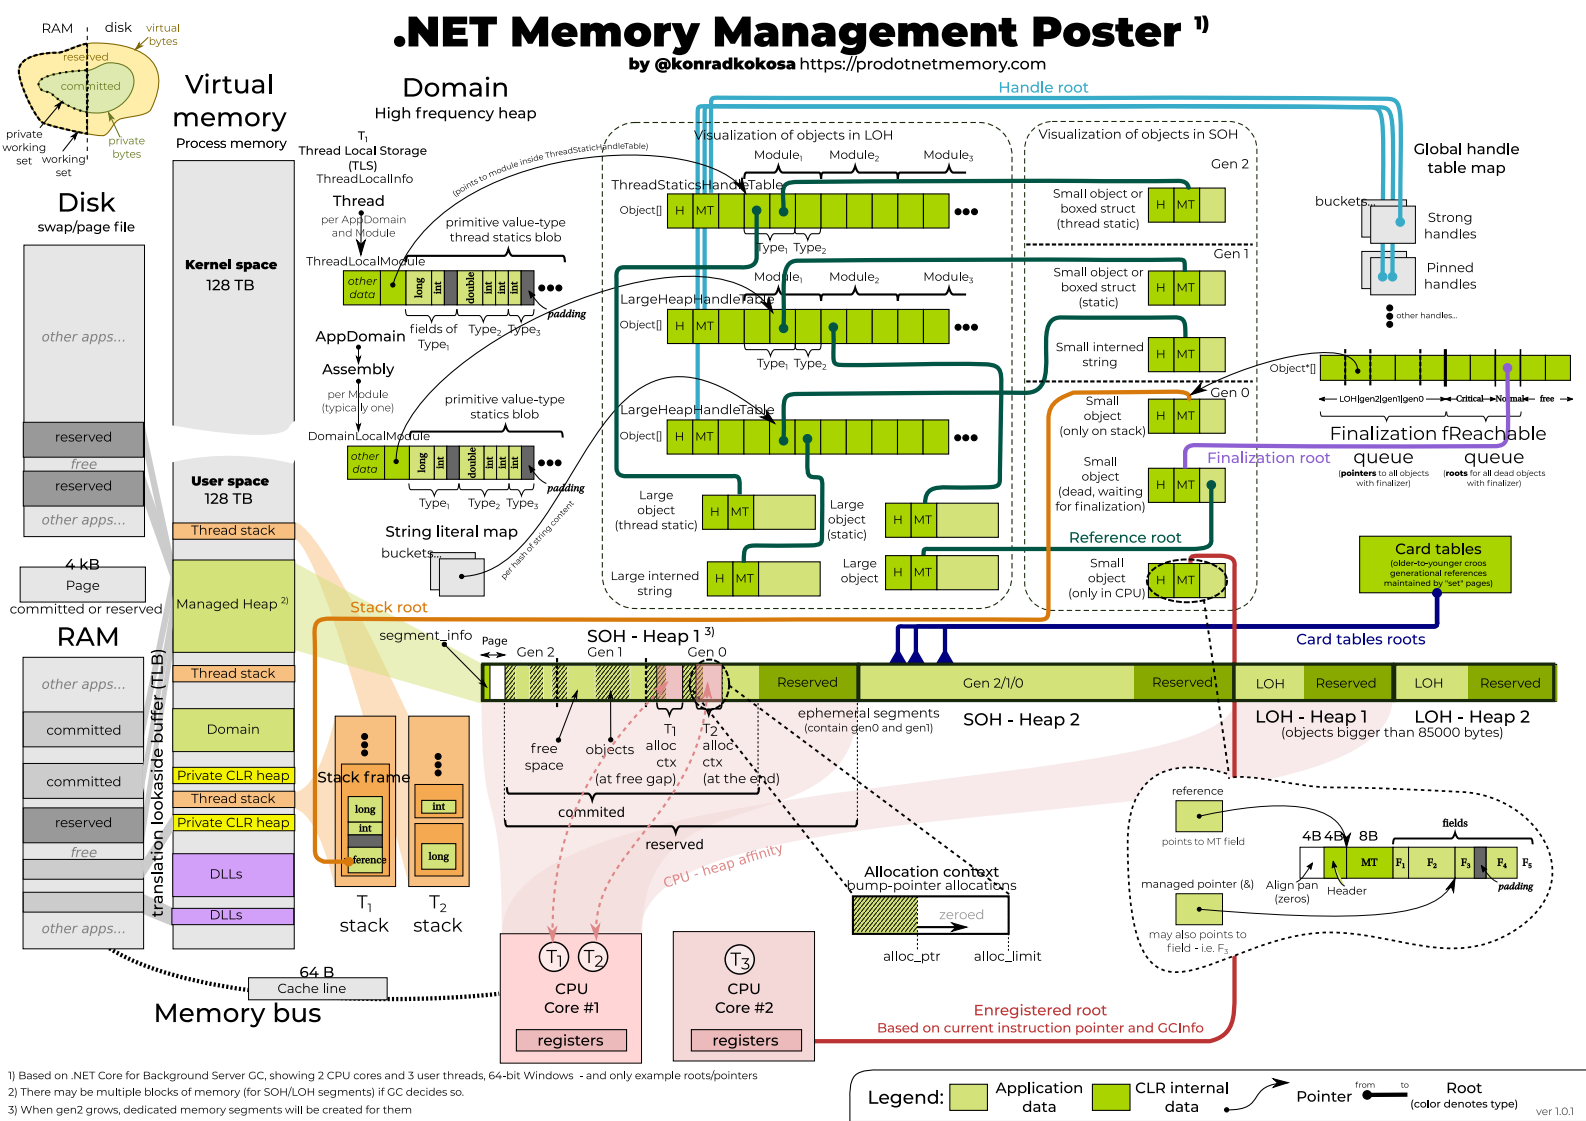 The image illustrate the Memory management architecture of .NET application. We will take a look of individual components of this.
.NET distinguishes between two types of memory:
- Managed Memory: Memory allocated and controlled by the CLR. Objects created using
newin C# typically reside here and are automatically cleaned up by the Garbage Collector (GC). - Unmanaged Memory: Memory not controlled by the CLR, such as memory allocated via native APIs, COM objects, or pointers (unsafe code). Developers are responsible for releasing this memory manually.
The Managed Heap
The managed heap is a region of memory where reference-type objects are stored. When an object is created, the CLR reserves enough space on the heap, initializes the object, and returns a reference to it. Allocation is very fast, usually involving just moving a pointer forward.
💡 Key Difference: Stack vs. Heap
- Stack: Fast, automatic cleanup for short-lived data like locals and parameters. Stores value types (in most cases), method parameters, and local variables. Memory is automatically reclaimed when a method exits.
- Heap: Managed by GC for objects that need to persist beyond method calls. Stores reference types and boxed value types. Memory is reclaimed by the GC, not immediately when objects go out of scope.
The heap is divided into generations (Gen 0, Gen 1, Gen 2) to optimize GC performance:
- Gen 0: Newly allocated objects. Most objects die here.
- Gen 1: Objects that survive Gen 0 collections.
- Gen 2: Long-lived objects, including static data.
Why Generations Matter: Generational GC exploits the “generational hypothesis” (a concept also used in JVMs, see Java GC Generations): most objects are short-lived, and older objects tend to live longer. This allows the GC to focus collections on younger generations, which are smaller and faster to scan.
- Collection Frequency: Gen 0 is collected most often (every few MB of allocations), Gen 1 less frequently, Gen 2 rarely (only during full GCs).
- Promotion: Objects that survive a Gen 0 collection move to Gen 1. Survivors of Gen 1 go to Gen 2.
- Full GC: When Gen 2 fills, a full heap collection occurs, which can be expensive.
- Large Objects: Objects >85KB go directly to Gen 2 (LOH) to avoid frequent copying.
In dumps, you can analyze generations with dumpheap -stat -gen <n> to see what’s accumulating where.
Garbage Collection (GC)
The Garbage Collector identifies objects that are no longer reachable, frees their memory, and compacts the heap to reduce fragmentation. This prevents memory leaks and dangling pointers.
- Generational GC: Based on the observation that most objects are short-lived, GC focuses on younger generations for efficiency.
- GC Process: Involves marking reachable objects from GC roots (static fields, stack variables, CPU registers), sweeping unreachable objects, and compacting the heap.
- GC Modes: Workstation GC (for responsiveness in client apps) vs. Server GC (for throughput in server applications with multiple heaps).
Large Object Heap (LOH)
Objects larger than approximately 85 KB are allocated on the Large Object Heap. The LOH is not compacted as frequently, which can cause fragmentation if not managed carefully. It’s collected only during Gen 2 collections.
Finalization and IDisposable
- Finalizers: Allow cleanup before an object is collected but delay reclamation and should be avoided unless necessary.
- IDisposable Pattern: Encourages deterministic cleanup for unmanaged resources (files, sockets, database connections) using the
Dispose()method, often with theusingstatement.
Memory Pressure and Optimization
To optimize performance:
- Avoid excessive allocations.
- Reuse objects.
- Minimize large object allocations.
- Prefer value types for small, immutable data.
Controlling the Garbage Collector
.NET provides several ways to influence GC behavior for better application performance:
- GC Modes:
- Workstation GC: Default for client apps, balances responsiveness and throughput.
- Server GC: For multi-core servers, uses multiple heaps for higher throughput.
- Latency Modes: Set via
System.Runtime.GCSettings:- Batch: Default, optimizes for throughput.
- Interactive: Reduces pause times for UI apps.
- LowLatency: Minimizes pauses, useful for real-time scenarios.
- SustainedLowLatency: Extended low-latency mode.
- NoGCRegion: Suppresses GC in critical sections.
Example:
1
2
3
4
5
6
7
8
9
10
using System.Runtime;

// Set low latency mode
GCSettings.LatencyMode = GCLatencyMode.LowLatency;

// Critical section
// ... your code ...

// Restore
GCSettings.LatencyMode = GCLatencyMode.Batch;
- Configuration via Environment Variables:
COMPlus_gcServer=1: Enable server GC.COMPlus_gcConcurrent=0: Disable concurrent GC for debugging.COMPlus_GCLatencyMode=1: Set to batch mode (1=batch, 2=interactive, etc.).DOTNET_GCHeapHardLimit: Set a hard limit on GC heap size (e.g., 100MB).DOTNET_GCHeapHardLimitPercent: Limit as percentage of total memory.
- GC Notifications: Use
GC.RegisterForFullGCNotification()to monitor and respond to GC events.
Common Memory Issues in .NET
- Memory leaks (from unintended references).
- Excessive GC pressure.
- LOH fragmentation.
- Improper finalizer use.
Analyzing Object Management in Dumps
In a dump, inspect the heap with:
dumpheap -stat: Object counts and sizes by type.dumpheap -mt <MethodTable>: Objects of a specific type.gcroot <ObjectAddress>: References keeping an object alive.
Example Scenario: Diagnosing a Memory Leak
Imagine a .NET web application that starts with normal memory usage but gradually consumes more RAM over time, leading to performance degradation. You suspect a memory leak and capture a dump using dotnet-dump collect -p <PID>.
Step 1: Load the dump in the analyzer.
1
dotnet-dump analyze myapp.dmp
Step 2: Check heap statistics to identify suspicious object types.
1
dumpheap -stat
This might show thousands of System.String or custom objects accumulating.
Step 3: Examine objects of a specific type.
1
dumpheap -mt <MethodTableAddress>
Replace <MethodTableAddress> with the MT from the stat output. This lists all instances.
Step 4: Find what keeps objects alive.
1
gcroot <ObjectAddress>
This traces references from GC roots to the object, revealing why it’s not collected (e.g., a static list holding references).
Step 5: Inspect the call stack if needed.
1
clrstack
To see the current thread’s stack, which might point to allocation sites.
By following these steps, you might discover that event handlers or cached data are preventing garbage collection, allowing you to fix the leak.
Example Scenario: Analyzing Long-Lived Objects in Gen 2
In a long-running server application, you notice high memory usage that doesn’t decrease much after GC. You capture a dump and want to investigate objects surviving to Gen 2.
Step 1: Load the dump.
1
dotnet-dump analyze myapp.dmp
Step 2: Check heap stats by generation.
1
dumpheap -stat -gen 2
This shows objects in Gen 2, which are long-lived.
Step 3: Identify large or numerous types.
Look for types with high counts or sizes, e.g., many System.Collections.Generic.Dictionary or custom cache objects.
Step 4: Examine specific objects.
1
dumpheap -mt <MethodTable> -gen 2
Lists Gen 2 objects of that type.
Step 5: Trace roots for a sample object.
1
gcroot <ObjectAddress>
Finds what’s keeping it alive, such as static fields or singleton instances.
Step 6: Check for unnecessary caching or static references. If objects are held by static collections, consider implementing expiration or weak references.
This helps optimize memory by reducing the footprint of long-lived objects.
Understanding .NET memory management allows for better dump analysis and application optimization.
Conclusion
There you have it—your crash course on .NET dumps! From capturing snapshots of unruly apps to diving into memory mysteries, these tools are your secret weapon for taming production gremlins. Remember, every great developer started with a single dump file. So grab dotnet-dump, experiment in staging, and watch your debugging skills soar. Got questions or wild dump stories? Drop them in the comments—let’s keep the conversation going!
Further Reading
- Microsoft Docs: Collect and analyze memory dumps
- Practical .NET memory dump analysis
- Java Platform, Standard Edition HotSpot Virtual Machine Garbage Collection Tuning Guide